Updated 26 October 2026
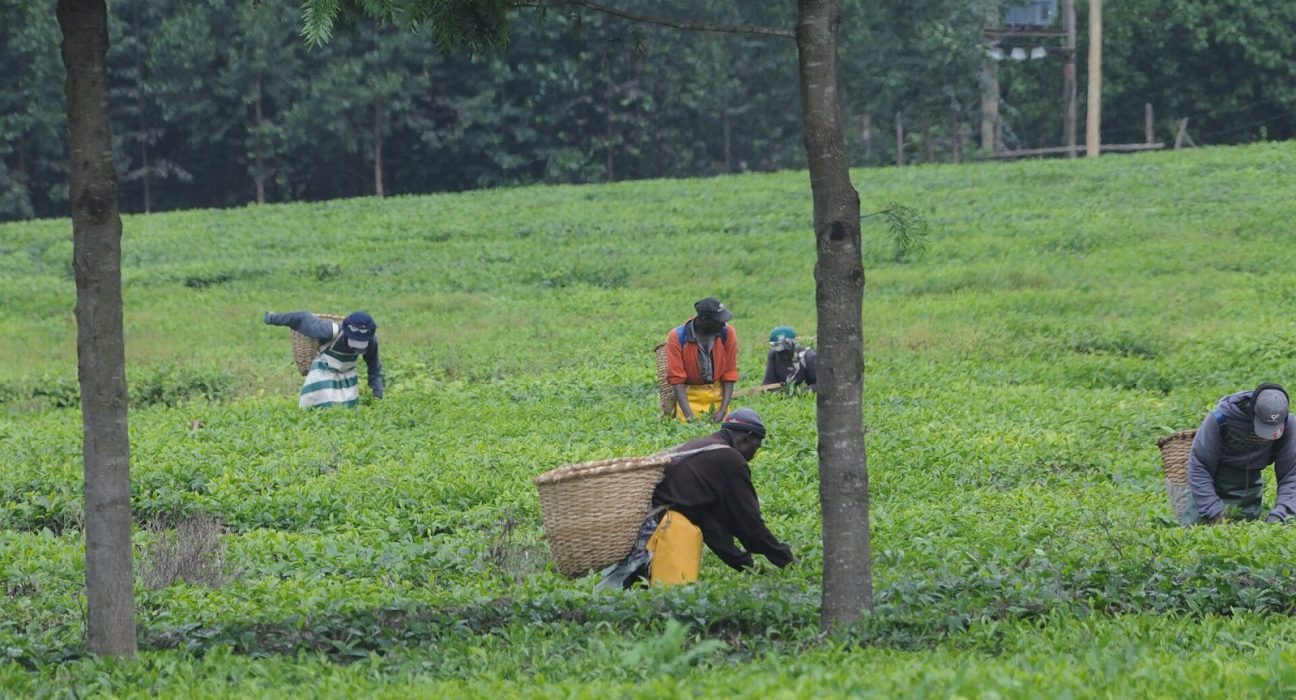
Kenya grows tea in 19 counties, but three of them do most of the work. In the latest official county figures, published in the Kenya National Bureau of Statistics (KNBS) National Agriculture Production Report 2025 using data from the Tea Board of Kenya, Bomet was the largest tea-producing county in 2024, followed by Nandi and Kericho. Together the three produced about 55% of all the made tea in the country.
This guide ranks every tea-growing county by 2024 output, shows how much land each one has under tea, and explains what changed from 2023. The 2024 figures are marked provisional by KNBS and can be revised in the next edition of the report.
Kenya’s Tea Harvest in 2024 at a Glance
Kenya produced 598.5 million kilograms of made tea in 2024, up 4.9% from 570.3 million kg in 2023. Made tea is the finished, processed product that goes to auction. To get it, farmers delivered about 2.54 billion kg of green leaf to factories, which works out at roughly 4.25 kg of green leaf for every kilogram of made tea.
Estates produced 313.0 million kg (about 52%) and smallholder farmers 285.5 million kg (about 48%). Estate output grew faster, by about 7.3%, against about 2.5% for smallholders. The area under tea rose by only 638 hectares to 228,414.7 hectares, which KNBS puts down to a shortage of suitable highland land, population pressure and competition from other farm enterprises.
Top Tea-Producing Counties in Kenya (2024)
The table ranks counties by made tea produced in 2024, as published in Table 5.2.1(b) of the KNBS report. The Tea Board reports Trans-Nzoia with Bungoma, and Kakamega with Vihiga, as combined figures, so they appear as one row each. The share column is our calculation from the national total.
| Rank | County | Made tea 2024 (million kg) | Share of national output | 2023 (million kg) | Change | Area under tea 2024 (ha) |
|---|---|---|---|---|---|---|
| 1 | Bomet | 115.1 | 19.2% | 110.7 | +4.0% | 47,202 |
| 2 | Nandi | 108.8 | 18.2% | 97.7 | +11.4% | 38,532 |
| 3 | Kericho | 105.8 | 17.7% | 104.8 | +1.0% | 39,201 |
| 4 | Murang’a | 51.1 | 8.5% | 47.3 | +8.0% | 17,577 |
| 5 | Kiambu | 42.7 | 7.1% | 39.0 | +9.5% | 19,096 |
| 6 | Nyamira | 37.0 | 6.2% | 39.3 | -5.8% | 16,083 |
| 7 | Meru | 31.0 | 5.2% | 32.8 | -5.3% | 12,952 |
| 8 | Nyeri | 24.3 | 4.1% | 21.7 | +12.4% | 7,843 |
| 9 | Kisii | 24.0 | 4.0% | 18.6 | +29.0% | 8,444 |
| 10 | Kirinyaga | 22.6 | 3.8% | 20.9 | +8.2% | 8,266 |
| 11 | Embu | 13.8 | 2.3% | 13.2 | +4.6% | 4,628 |
| 12 | Nakuru | 7.4 | 1.2% | 8.5 | -12.8% | 2,759 |
| 13 | Tharaka-Nithi | 4.9 | 0.8% | 4.7 | +4.3% | 1,801 |
| 14 | Narok | 3.4 | 0.6% | 3.7 | -9.7% | 1,322 |
| 15 | Kakamega/Vihiga | 3.2 | 0.5% | 2.4 | +30.3% | 902 |
| 16 | Trans-Nzoia/Bungoma | 2.3 | 0.4% | 3.0 | -22.8% | 807 |
| 17 | Elgeyo Marakwet | 1.0 | 0.2% | 2.1 | -53.8% | 1,000 |
Source: KNBS National Agriculture Production Report 2025, Tables 5.2.1(b) and 5.2.2 (Tea Board of Kenya data; 2024 provisional). Figures rounded.
Which County Produces the Most Tea in Kenya?
Bomet. It produced about 115.1 million kg of made tea in 2024 and also has the largest area under tea of any county, at 47,202 hectares, which KNBS says is about 21% of the national tea area. Bomet overtook Kericho as the top producer in 2023 and widened the gap in 2024.
Kericho, the county most Kenyans associate with tea, is still a giant at 105.8 million kg, but its output grew by only about 1% and its recorded tea area fell slightly in 2024. Nandi had the biggest gain of the top three, adding about 11 million kg to move into second place.
West of the Rift Valley vs East of the Rift
The Tea Board groups counties into two regions. Counties West of the Rift (Kericho, Bomet, Nandi, Nyamira, Kisii, Nakuru, Trans-Nzoia, Bungoma, Kakamega, Vihiga, Narok and Elgeyo Marakwet) produced 408.1 million kg, or about 68% of the national total. East of the Rift (Murang’a, Kiambu, Meru, Nyeri, Kirinyaga, Embu and Tharaka-Nithi) produced 190.4 million kg, about 32%. That split matches the land: KNBS says 68% of the area under tea is in the West of Rift.
Murang’a is the leading tea county east of the Rift, followed by Kiambu. Interestingly, Kiambu has more land under tea than Murang’a (19,096 ha against 17,577 ha) but produced less tea from it in 2024.
Biggest Gains and Falls in 2024
- Kisii recovered strongly, up about 29% to 24.0 million kg, after a dip in 2023.
- Nyeri rose about 12% and Nandi about 11%.
- Nyamira and Meru both fell by about 5%, and Nakuru by about 13%.
- Elgeyo Marakwet more than halved its output to under 1 million kg, the lowest of any tea county.
Small counties swing more in percentage terms because a single factory catchment or a dry spell can move their totals a lot, so year-on-year changes there should be read with care.
Where Kenya’s Tea Goes
Most of the crop is exported. KNBS says exports account for over 90% of production, and export volume rose 13.7% in 2024 to 594.5 million kg, shipped to 96 destinations. Pakistan remained the largest buyer at 206.3 million kg (about 34.7% of exports), followed by Egypt, the United Kingdom and the UAE. The average auction price was USD 2.2 per kg in 2024, the same as in 2023.
Payments to farmers are a frequent source of dispute, especially around the annual bonus. For recent coverage, see our reports on the tea bonus row and the four tea factories summoned over farmer returns.
Why These Rankings Matter
Tea output drives incomes in the main growing counties through green leaf payments and bonuses, factory jobs and transport. Businesses that sell farm inputs, offer agricultural loans or run logistics can use these figures to see where the volumes are. Counties with large areas but flat output may also be where extension services and better farm practices could make the biggest difference. If you are looking at other crops, see our top maize-producing counties, built from the same KNBS report.
How the Figures Are Collected
The county tea figures come from the Tea Board of Kenya, which regulates the sector, and are published by KNBS together with other crop and livestock data validated with the Ministry of Agriculture and Livestock Development. The latest year is provisional, and earlier years can also be revised between editions.
Frequently Asked Questions
Which is the leading tea-producing county in Kenya?
Bomet, with about 115.1 million kg of made tea in 2024, ahead of Nandi (108.8 million kg) and Kericho (105.8 million kg).
How many counties grow tea in Kenya?
KNBS lists 19 tea-growing counties, from Kericho, Bomet and Nandi in the West of Rift to Murang’a, Kiambu, Meru and Nyeri in the East.
How much tea did Kenya produce in 2024?
598.5 million kg of made tea, up 4.9% on 2023, from about 2.54 billion kg of green leaf.
Do smallholders or estates produce more tea?
In 2024 estates produced slightly more, about 52% of made tea, while smallholders produced about 48%.
Prefer WhatsApp? Follow Business Radar on WhatsApp
Weekly, free. We only use your email for this newsletter and you can unsubscribe in one click. Privacy policy.