Nairobi property prices rose 2.3% in the third quarter of 2026 in the established suburbs, the fastest quarterly rise in four years, while prices in satellite towns fell 0.6%, according to HassConsult’s House Price Index for July to September 2026. Our Nairobi property price index tracker brings together the area-by-area tables for houses, apartments, rents and land so you can compare an asking price with the market.
Checked on 10 November 2026 against HassConsult’s Q3 2026 House Price Index and Q3 2026 Land Price Index. The indices track asking prices, not completed sales.
Nairobi property price index at a glance
| Measure | Nairobi suburbs (18) | Satellite towns (14) |
|---|---|---|
| Average asking price, all property | KSh 33,884,830 | KSh 14,433,355 |
| Sale prices, quarter change | +2.3% | -0.6% |
| Sale prices, annual change | +5.2% | -2.0% |
| Rents, quarter change | +2.7% | +0.4% |
| Rents, annual change | +7.1% | +4.1% |
| Average land price per acre | KSh 233.5 million | KSh 33.7 million |
| Land, quarter change | +0.70% | +0.65% |
Houses in Nairobi suburbs
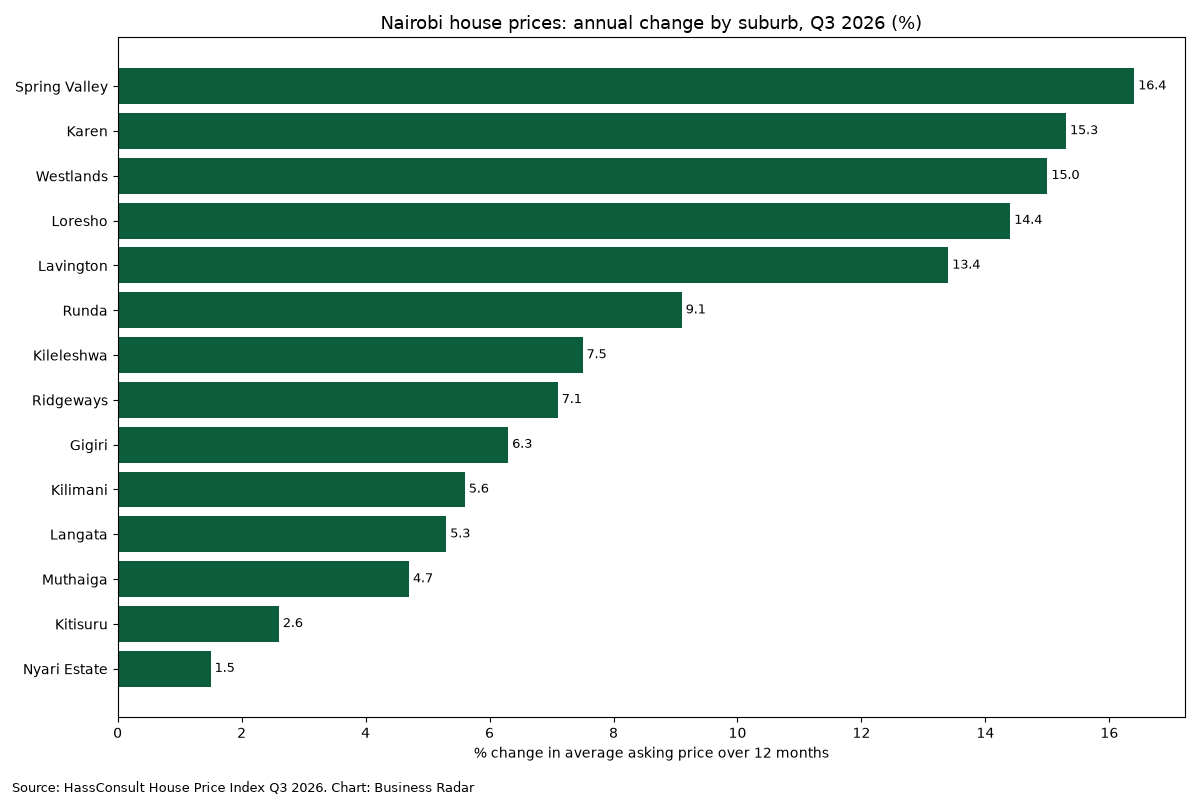
Spring Valley houses led with a 16.4% rise over the year, followed by Karen (15.3%) and Westlands (15.0%). HassConsult puts average house asking prices at KSh 79.4 million in Spring Valley, KSh 64.5 million in Westlands, KSh 118.1 million in Muthaiga and KSh 119.3 million in Karen.
| Area | Sale prices, quarter | Sale prices, year | Rents, quarter | Rents, year |
|---|---|---|---|---|
| Spring Valley | +6.8% | +16.4% | +2.5% | +8.7% |
| Karen | +5.2% | +15.3% | +2.0% | +8.2% |
| Westlands | +5.9% | +15.0% | +2.4% | +9.4% |
| Loresho | +5.2% | +14.4% | +6.2% | +14.9% |
| Lavington | +2.7% | +13.4% | +3.7% | +10.5% |
| Runda | +4.7% | +9.1% | +3.6% | +14.5% |
| Kileleshwa | +3.3% | +7.5% | +3.6% | +13.6% |
| Ridgeways | +2.0% | +7.1% | +2.6% | +12.1% |
| Gigiri | +3.4% | +6.3% | +3.9% | +13.8% |
| Kilimani | +0.3% | +5.6% | +0.1% | +4.1% |
| Langata | +1.0% | +5.3% | +0.1% | -0.7% |
| Muthaiga | +5.5% | +4.7% | +4.5% | +10.1% |
| Kitisuru | +0.7% | +2.6% | +5.1% | +5.6% |
| Nyari Estate | +1.7% | +1.5% | +3.2% | +10.3% |
Source: HassConsult House Price Index, Q3 2026. The index is built from asking prices, not completed sales. Sorted by annual change in sale prices.
Apartments in Nairobi suburbs
Apartments are weaker. Muthangari rose 10.7% over the year, but Westlands apartments fell 6.4% and Parklands 3.7%, a sign of how much new supply is coming. Our projects tracker shows 10 large new filings in the Westlands area alone.
| Area | Sale prices, quarter | Sale prices, year | Rents, quarter | Rents, year |
|---|---|---|---|---|
| Muthangari | +4.6% | +10.7% | +0.7% | +7.2% |
| Kilimani | +1.1% | +4.8% | +3.0% | +5.6% |
| Kileleshwa | +2.8% | +4.2% | +0.7% | +2.0% |
| Langata | +0.8% | +3.9% | +3.4% | +0.8% |
| Riverside | -1.3% | +1.8% | -2.5% | +0.8% |
| Lavington | +1.2% | -1.9% | -0.1% | +1.2% |
| Upperhill | -0.5% | -2.4% | +0.3% | -0.9% |
| Parklands | -2.4% | -3.7% | +0.9% | +1.2% |
| Westlands | -2.2% | -6.4% | +2.2% | +2.3% |
Source: HassConsult House Price Index, Q3 2026. The index is built from asking prices, not completed sales. Sorted by annual change in sale prices.
Houses in satellite towns
| Area | Sale prices, quarter | Sale prices, year | Rents, quarter | Rents, year |
|---|---|---|---|---|
| Tigoni | +1.5% | +5.5% | +2.8% | +10.0% |
| Ruiru | +1.3% | +3.6% | +2.2% | +3.6% |
| Limuru | +1.5% | +0.3% | +2.0% | +7.9% |
| Athi River | +0.2% | -0.8% | +2.2% | +8.1% |
| Kitengela | -0.5% | -0.9% | +2.1% | +6.5% |
| Juja | -0.6% | -1.0% | +4.0% | +13.0% |
| Kiserian | -0.1% | -3.0% | +0.6% | -2.1% |
| Kiambu | +0.8% | -4.5% | -0.8% | +0.7% |
| Ongata Rongai | -1.0% | -4.8% | +2.6% | +10.7% |
| Ngong | -1.2% | -7.3% | -0.3% | +6.7% |
Source: HassConsult House Price Index, Q3 2026. The index is built from asking prices, not completed sales. Sorted by annual change in sale prices.
Apartments in satellite towns
| Area | Sale prices, quarter | Sale prices, year | Rents, quarter | Rents, year |
|---|---|---|---|---|
| Syokimau | +0.5% | +7.2% | +1.1% | +6.8% |
| Kitengela | +0.5% | +4.9% | +0.2% | -2.5% |
| Thika | +1.0% | +1.6% | +2.0% | +8.1% |
| Mlolongo | -0.3% | -0.3% | +0.4% | +9.6% |
| Athi River | +0.3% | -2.7% | +3.2% | +12.4% |
| Ngong | -0.5% | -2.7% | -2.0% | -0.9% |
| Kiambu | -1.2% | -3.4% | -0.6% | +2.2% |
| Ongata Rongai | +1.5% | -4.3% | +2.4% | +9.4% |
| Ruaka | -0.2% | -4.6% | -2.7% | -7.2% |
Source: HassConsult House Price Index, Q3 2026. The index is built from asking prices, not completed sales. Sorted by annual change in sale prices.
Land prices per acre: Nairobi suburbs
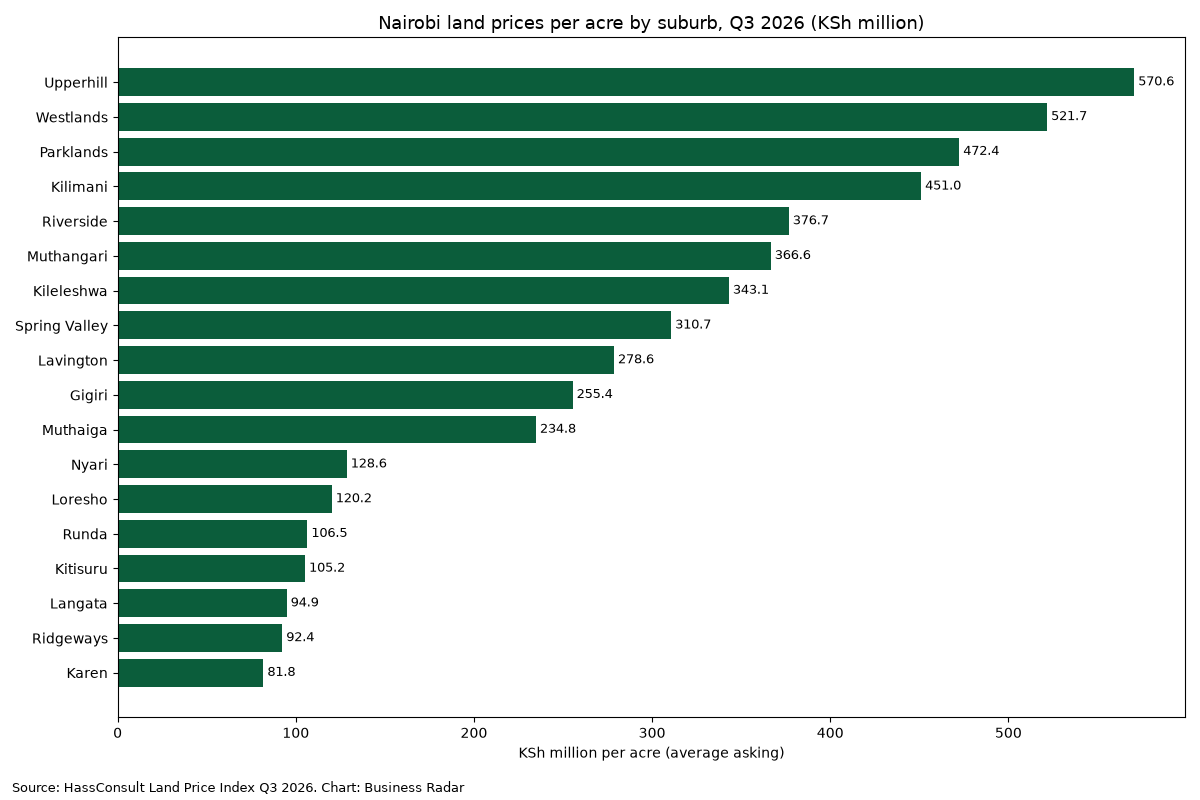
Upper Hill is the most expensive land in the index at an average KSh 570.6 million an acre, followed by Westlands at KSh 521.7 million. Karen is the cheapest suburb at KSh 81.8 million but grew fastest over the year, up 10.9%. Our Karen, Runda and Muthaiga land price guide goes deeper on the prime suburbs.
| Area | Average per acre | Middle half of asking prices (25th–75th percentile) | Quarter change | Annual change |
|---|---|---|---|---|
| Upperhill | KSh 570.6m | KSh 465.0m – 639.8m | +0.3% | +2.9% |
| Westlands | KSh 521.7m | KSh 462.1m – 568.4m | +2.7% | +3.5% |
| Parklands | KSh 472.4m | KSh 400.0m – 539.0m | +0.2% | +1.5% |
| Kilimani | KSh 451.0m | KSh 372.1m – 509.3m | +1.2% | +6.7% |
| Riverside | KSh 376.7m | KSh 312.3m – 440.1m | -1.5% | +4.5% |
| Muthangari | KSh 366.6m | KSh 309.5m – 400.0m | -3.1% | -8.6% |
| Kileleshwa | KSh 343.1m | KSh 300.0m – 396.7m | +0.9% | +4.2% |
| Spring Valley | KSh 310.7m | KSh 185.0m – 473.6m | -1.2% | +1.6% |
| Lavington | KSh 278.6m | KSh 210.9m – 340.1m | +0.4% | +2.1% |
| Gigiri | KSh 255.4m | KSh 200.0m – 300.1m | -2.2% | -0.8% |
| Muthaiga | KSh 234.8m | KSh 190.7m – 250.0m | +2.0% | +0.3% |
| Nyari | KSh 128.6m | KSh 104.2m – 140.0m | +0.3% | +7.7% |
| Loresho | KSh 120.2m | KSh 90.0m – 150.0m | +1.9% | +2.1% |
| Runda | KSh 106.5m | KSh 90.0m – 120.8m | +0.8% | +8.4% |
| Kitisuru | KSh 105.2m | KSh 81.8m – 120.0m | +2.6% | +4.5% |
| Langata | KSh 94.9m | KSh 70.0m – 101.5m | +0.2% | +7.7% |
| Ridgeways | KSh 92.4m | KSh 77.6m – 100.0m | -0.6% | +0.9% |
| Karen | KSh 81.8m | KSh 70.0m – 92.0m | +3.0% | +10.9% |
Source: HassConsult Land Price Index, Q3 2026. The index is built from asking prices, not completed sales. Sorted by price per acre.
Land prices per acre: satellite towns
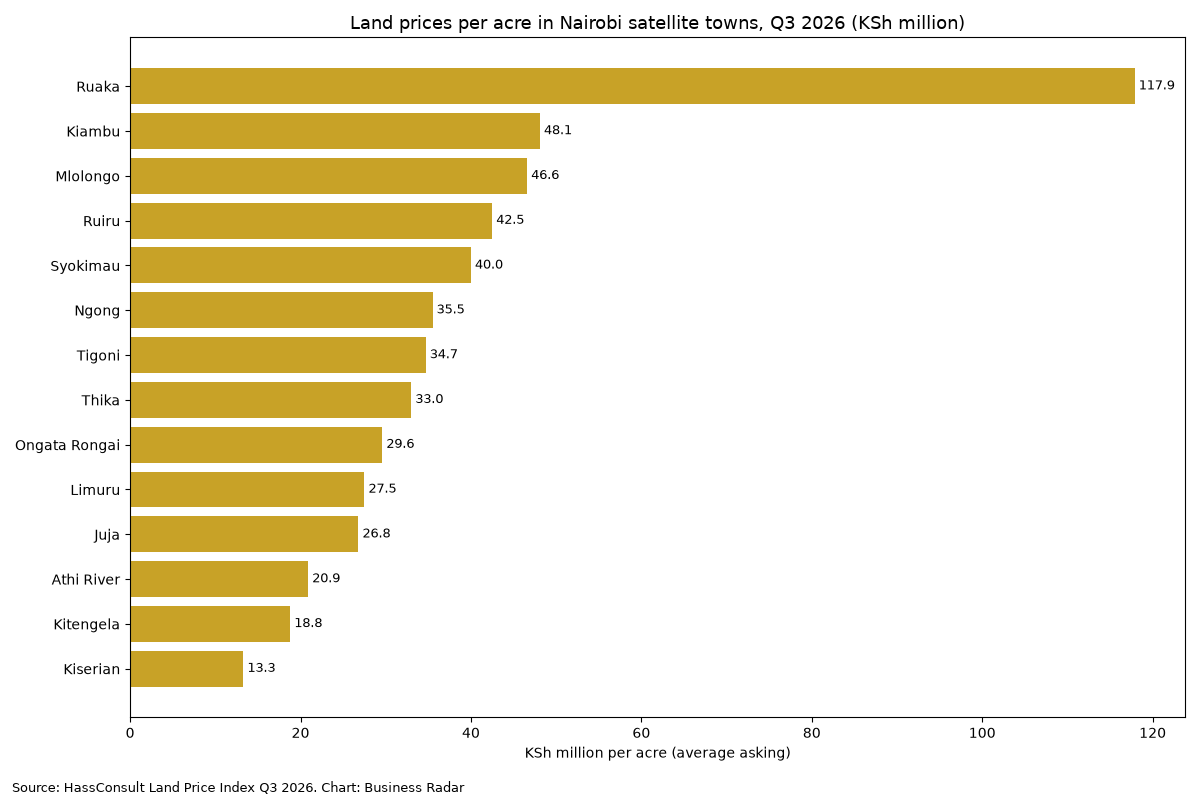
Ruaka is the priciest satellite town at KSh 117.9 million an acre. Kiserian (KSh 13.3 million) and Kitengela (KSh 18.8 million) are the cheapest, and Ruiru grew most over the year at 11.5%. HassConsult notes that over two years land in 12 of the 14 towns gained less than a rolling 91-day Treasury bill would have earned.
| Area | Average per acre | Middle half of asking prices (25th–75th percentile) | Quarter change | Annual change |
|---|---|---|---|---|
| Ruaka | KSh 117.9m | KSh 90.9m – 146.2m | +1.9% | +6.2% |
| Kiambu | KSh 48.1m | KSh 28.0m – 60.0m | -1.0% | -1.2% |
| Mlolongo | KSh 46.6m | KSh 32.0m – 60.0m | -2.2% | -0.8% |
| Ruiru | KSh 42.5m | KSh 26.0m – 54.4m | +0.8% | +11.5% |
| Syokimau | KSh 40.0m | KSh 32.0m – 44.0m | +1.5% | +0.2% |
| Ngong | KSh 35.5m | KSh 24.0m – 44.0m | +2.2% | -1.9% |
| Tigoni | KSh 34.7m | KSh 25.0m – 40.0m | -0.1% | -0.2% |
| Thika | KSh 33.0m | KSh 18.0m – 39.5m | +2.0% | +9.3% |
| Ongata Rongai | KSh 29.6m | KSh 18.3m – 35.8m | -0.9% | +4.0% |
| Limuru | KSh 27.5m | KSh 16.0m – 35.0m | +1.2% | +2.2% |
| Juja | KSh 26.8m | KSh 14.0m – 34.3m | +0.3% | +5.1% |
| Athi River | KSh 20.9m | KSh 12.1m – 25.4m | +0.7% | -2.3% |
| Kitengela | KSh 18.8m | KSh 9.1m – 21.6m | +0.1% | +1.0% |
| Kiserian | KSh 13.3m | KSh 6.0m – 18.4m | -2.0% | -0.5% |
Source: HassConsult Land Price Index, Q3 2026. The index is built from asking prices, not completed sales. Sorted by price per acre.
Rents in the Nairobi property price index
Suburban rents rose 2.7% in the quarter and 7.1% over the year, faster than sale prices. HassConsult lists average monthly house rents of about KSh 338,100 in Loresho, KSh 350,100 in Kitisuru, KSh 370,900 in Muthaiga and KSh 402,100 in Gigiri. In the satellite towns rents rose 0.4% in the quarter and 4.1% over the year, so tenants there are seeing smaller increases than in the city.
What is moving prices
HassConsult’s report links the stronger suburban market to cheaper credit, noting that the average commercial bank lending rate fell from 17.2% in November 2024 to 14.4% in September 2026, based on Central Bank of Kenya data. Lower rates help buyers who borrow, which matters most for family houses in the established suburbs. In the satellite towns, the report says demand is more sensitive to affordability and competing housing options, and average asking prices slipped.
New supply also matters. Apartments in Westlands and Parklands, where many towers have been filed with NEMA this year, fell over the year even as houses in the same suburbs rose. Our Nairobi projects tracker lists those filings.
How to use these numbers
- Use the area average to judge whether an asking price is in range, then get an independent valuation before you sign.
- Add stamp duty and transfer fees with our land transfer cost calculator.
- Test whether to rent or buy with our rent vs buy calculator.
- Price a loan with the mortgage calculator and compare banks in mortgage rates compared.
- For the official national picture, see our story on the KNBS residential property price index.
Back to the Kenya real estate hub.
Frequently asked questions
Are Nairobi property prices going up in 2026?
In the established suburbs, yes: HassConsult’s Q3 2026 index shows asking prices up 2.3% in the quarter and 5.2% over the year. In satellite towns asking prices fell 0.6% in the quarter and 2.0% over the year.
Where is the most expensive land in Nairobi?
Upper Hill, at an average of KSh 570.6 million an acre in Q3 2026, followed by Westlands at KSh 521.7 million and Parklands at KSh 472.4 million.
Where is the cheapest land near Nairobi?
Among the 14 satellite towns in the index, Kiserian averages KSh 13.3 million an acre and Kitengela KSh 18.8 million.
How often is the Nairobi property price index tracker updated?
Each quarter, when HassConsult publishes its next index. We add official KNBS index releases as they come out.